ACP personnalisée en R
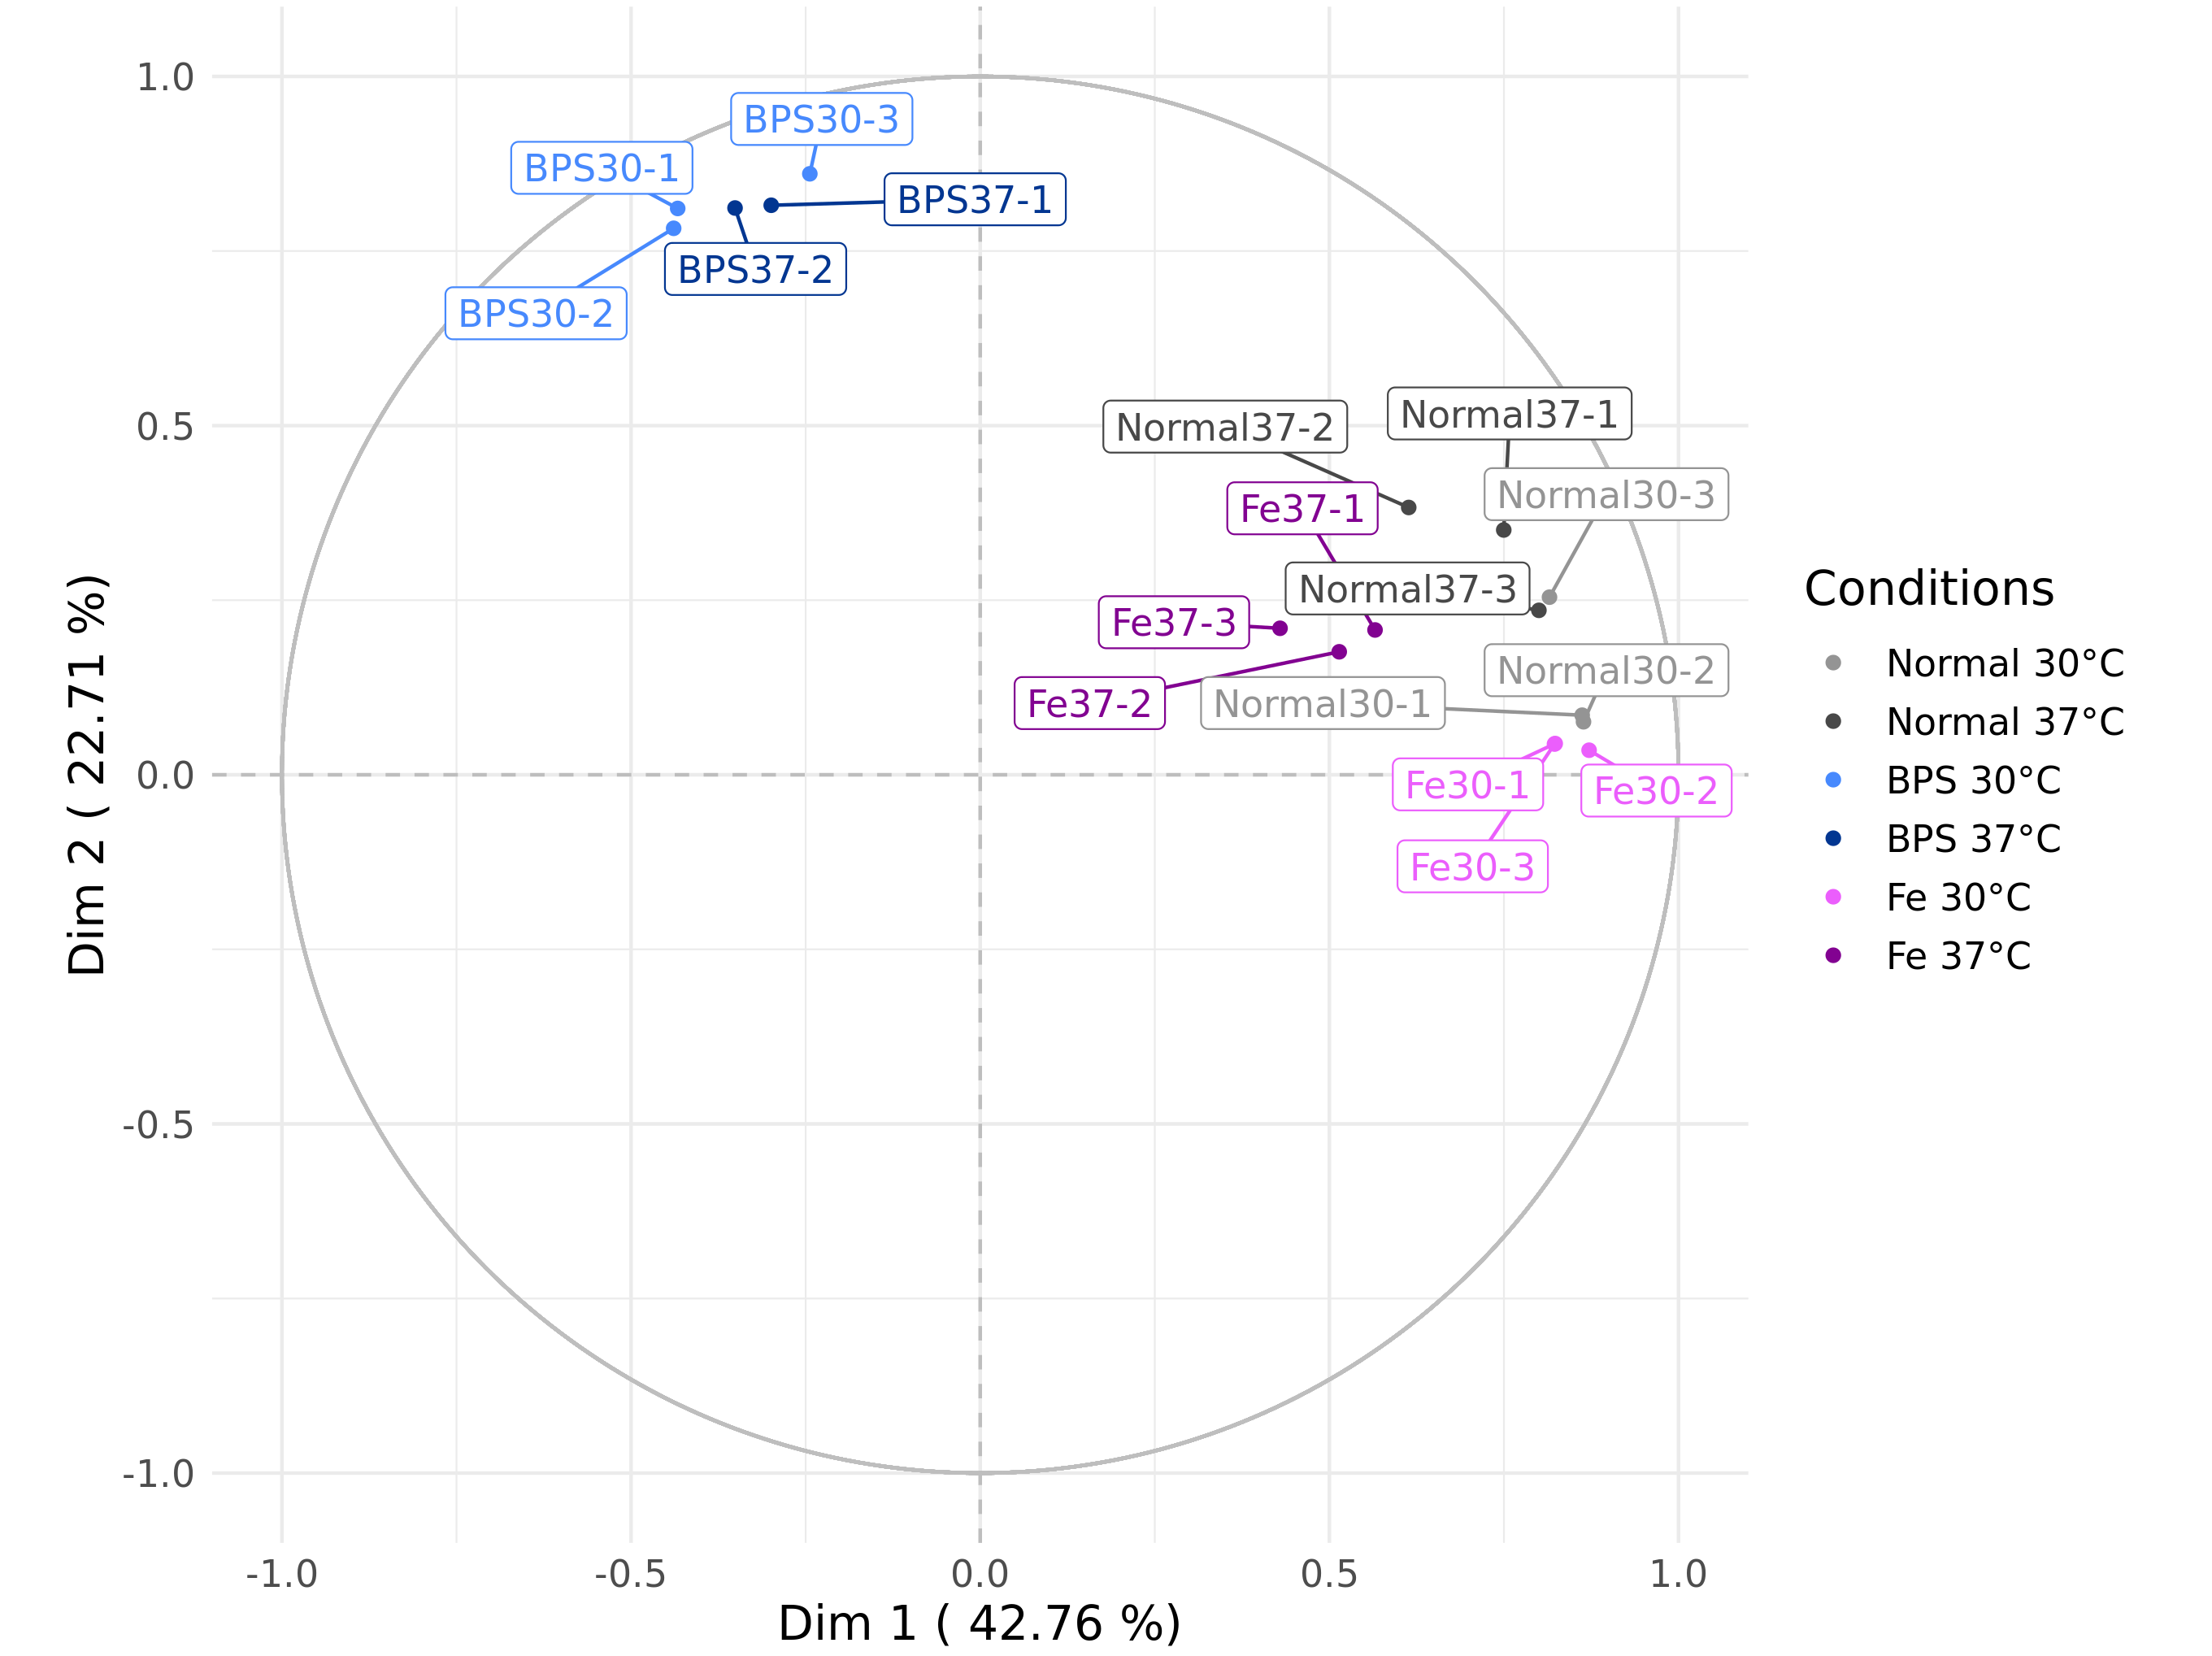
Lorsque j’ai voulu contrôler la qualité des réplicats dans l’étude de l’homéostasie du fer chez C. glabrata,
je souhaitais colorer les éléments par groupe d’expérience et avoir des étiquettes qui ne supperposait pas.
Ne trouvant pas de fonction clé en main le permettant, je propose le code suivant qui utilise ggplot.
Le résultat
Comment faire ?
Langage : R
Information de la session
1
2
3
4
5
6
7
8
9
10
11
12
13
14
15
16
17
18
19
20
21
22
23
24
25
26
27
28
29
30
31
32
33
34
35
36
37
38
39
40
41
42
43
44
> sessionInfo()
R version 3.6.3 (2020-02-29)
Platform: x86_64-conda_cos6-linux-gnu (64-bit)
Running under: CentOS Linux 7 (Core)

Matrix products: default
BLAS/LAPACK: /shared/mfs/data/software/miniconda/envs/r-3.6.3/lib/libopenblasp-r0.3.9.so

Random number generation:
RNG: Mersenne-Twister
Normal: Inversion
Sample: Rounding

locale:
[1] LC_CTYPE=en_US.UTF-8 LC_NUMERIC=C LC_TIME=en_US.UTF-8 LC_COLLATE=en_US.UTF-8
[5] LC_MONETARY=en_US.UTF-8 LC_MESSAGES=en_US.UTF-8 LC_PAPER=en_US.UTF-8 LC_NAME=C
[9] LC_ADDRESS=C LC_TELEPHONE=C LC_MEASUREMENT=en_US.UTF-8 LC_IDENTIFICATION=C

attached base packages:
[1] grid stats graphics grDevices utils datasets methods base

other attached packages:
[1] rvest_0.3.5 scales_1.1.1 ggrepel_0.8.2 ggforce_0.3.1
[5] readxl_1.3.1 FactoMineR_2.3 factoextra_1.0.7 egg_0.4.5
[9] gridExtra_2.3 ontologyIndex_2.5 reshape2_1.4.4 dplyr_0.8.5
[13] plotly_4.9.2.1 ggplot2_3.3.1 igraph_1.2.5 visNetwork_2.0.9
[17] DT_0.13 seqinr_3.6-1 xml2_1.3.2 jsonlite_1.6.1
[21] httr_1.4.1 colourpicker_1.0 shinyhelper_0.3.2 shinycssloaders_0.3
[25] shinyWidgets_0.5.1 shinydashboardPlus_0.7.0 shinydashboard_0.7.1 shinyalert_1.0
[29] shinyjs_1.1 shiny_1.4.0.2

loaded via a namespace (and not attached):
[1] tidyr_1.1.0 viridisLite_0.3.0 assertthat_0.2.1 selectr_0.4-2 cellranger_1.1.0
[6] yaml_2.2.1 pillar_1.4.4 lattice_0.20-41 glue_1.4.1 digest_0.6.25
[11] promises_1.1.0 polyclip_1.10-0 colorspace_1.4-1 htmltools_0.4.0 httpuv_1.5.2
[16] plyr_1.8.6 pkgconfig_2.0.3 purrr_0.3.4 xtable_1.8-4 tweenr_1.0.1
[21] later_1.0.0 tibble_3.0.1 farver_2.0.3 ellipsis_0.3.1 withr_2.2.0
[26] lazyeval_0.2.2 cli_2.0.2 magrittr_1.5 crayon_1.3.4 mime_0.9
[31] fansi_0.4.1 MASS_7.3-51.6 tools_3.6.3 data.table_1.12.8 lifecycle_0.2.0
[36] stringr_1.4.0 munsell_0.5.0 cluster_2.1.0 ade4_1.7-15 flashClust_1.01-2
[41] compiler_3.6.3 rlang_0.4.6 rstudioapi_0.11 htmlwidgets_1.5.1 crosstalk_1.1.0.1
[46] leaps_3.1 miniUI_0.1.1.1 gtable_0.3.0 curl_4.3 R6_2.4.1
[51] fastmap_1.0.1 stringi_1.4.6 Rcpp_1.0.4.6 vctrs_0.3.0 scatterplot3d_0.3-41
[56] tidyselect_1.1.0