Barplot avec ggplot
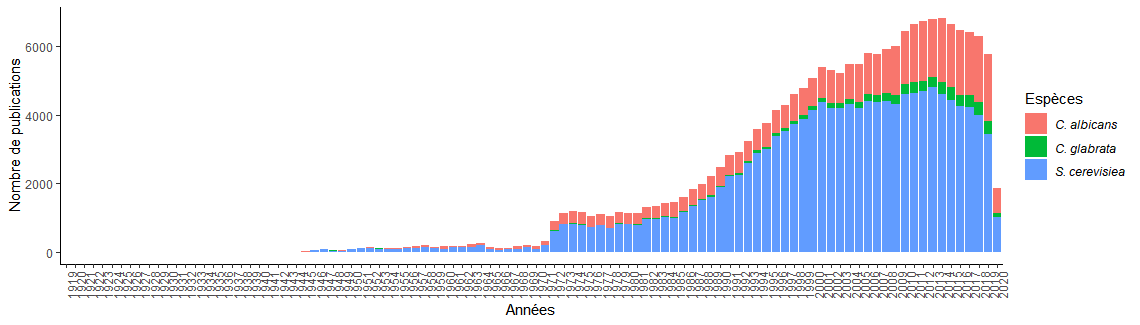
Ce code a été utilisé dans le manuscrit pour créer la figure “Évolution du nombre de publications au cours du temps associées aux espèces de levures S. cerevisiae, C. albicans et C. glabrata”. Les données ont été obtenues de la base de données PubMed après une recherche du nom de des espèces.
Le résultat
Comment faire ?
Langage : R
Information de la session
1
2
3
4
5
6
7
8
9
10
11
12
13
14
15
16
17
18
19
20
21
22
23
24
25
26
27
28
29
30
31
32
33
34
35
36
37
38
39
40
41
42
43
44
> sessionInfo()
R version 3.6.3 (2020-02-29)
Platform: x86_64-conda_cos6-linux-gnu (64-bit)
Running under: CentOS Linux 7 (Core)

Matrix products: default
BLAS/LAPACK: /shared/mfs/data/software/miniconda/envs/r-3.6.3/lib/libopenblasp-r0.3.9.so

Random number generation:
RNG: Mersenne-Twister
Normal: Inversion
Sample: Rounding

locale:
[1] LC_CTYPE=en_US.UTF-8 LC_NUMERIC=C LC_TIME=en_US.UTF-8 LC_COLLATE=en_US.UTF-8
[5] LC_MONETARY=en_US.UTF-8 LC_MESSAGES=en_US.UTF-8 LC_PAPER=en_US.UTF-8 LC_NAME=C
[9] LC_ADDRESS=C LC_TELEPHONE=C LC_MEASUREMENT=en_US.UTF-8 LC_IDENTIFICATION=C

attached base packages:
[1] grid stats graphics grDevices utils datasets methods base

other attached packages:
[1] rvest_0.3.5 scales_1.1.1 ggrepel_0.8.2 ggforce_0.3.1
[5] readxl_1.3.1 FactoMineR_2.3 factoextra_1.0.7 egg_0.4.5
[9] gridExtra_2.3 ontologyIndex_2.5 reshape2_1.4.4 dplyr_0.8.5
[13] plotly_4.9.2.1 ggplot2_3.3.1 igraph_1.2.5 visNetwork_2.0.9
[17] DT_0.13 seqinr_3.6-1 xml2_1.3.2 jsonlite_1.6.1
[21] httr_1.4.1 colourpicker_1.0 shinyhelper_0.3.2 shinycssloaders_0.3
[25] shinyWidgets_0.5.1 shinydashboardPlus_0.7.0 shinydashboard_0.7.1 shinyalert_1.0
[29] shinyjs_1.1 shiny_1.4.0.2

loaded via a namespace (and not attached):
[1] tidyr_1.1.0 viridisLite_0.3.0 assertthat_0.2.1 selectr_0.4-2 cellranger_1.1.0
[6] yaml_2.2.1 pillar_1.4.4 lattice_0.20-41 glue_1.4.1 digest_0.6.25
[11] promises_1.1.0 polyclip_1.10-0 colorspace_1.4-1 htmltools_0.4.0 httpuv_1.5.2
[16] plyr_1.8.6 pkgconfig_2.0.3 purrr_0.3.4 xtable_1.8-4 tweenr_1.0.1
[21] later_1.0.0 tibble_3.0.1 farver_2.0.3 ellipsis_0.3.1 withr_2.2.0
[26] lazyeval_0.2.2 cli_2.0.2 magrittr_1.5 crayon_1.3.4 mime_0.9
[31] fansi_0.4.1 MASS_7.3-51.6 tools_3.6.3 data.table_1.12.8 lifecycle_0.2.0
[36] stringr_1.4.0 munsell_0.5.0 cluster_2.1.0 ade4_1.7-15 flashClust_1.01-2
[41] compiler_3.6.3 rlang_0.4.6 rstudioapi_0.11 htmlwidgets_1.5.1 crosstalk_1.1.0.1
[46] leaps_3.1 miniUI_0.1.1.1 gtable_0.3.0 curl_4.3 R6_2.4.1
[51] fastmap_1.0.1 stringi_1.4.6 Rcpp_1.0.4.6 vctrs_0.3.0 scatterplot3d_0.3-41
[56] tidyselect_1.1.0