Google trends et ggplot2
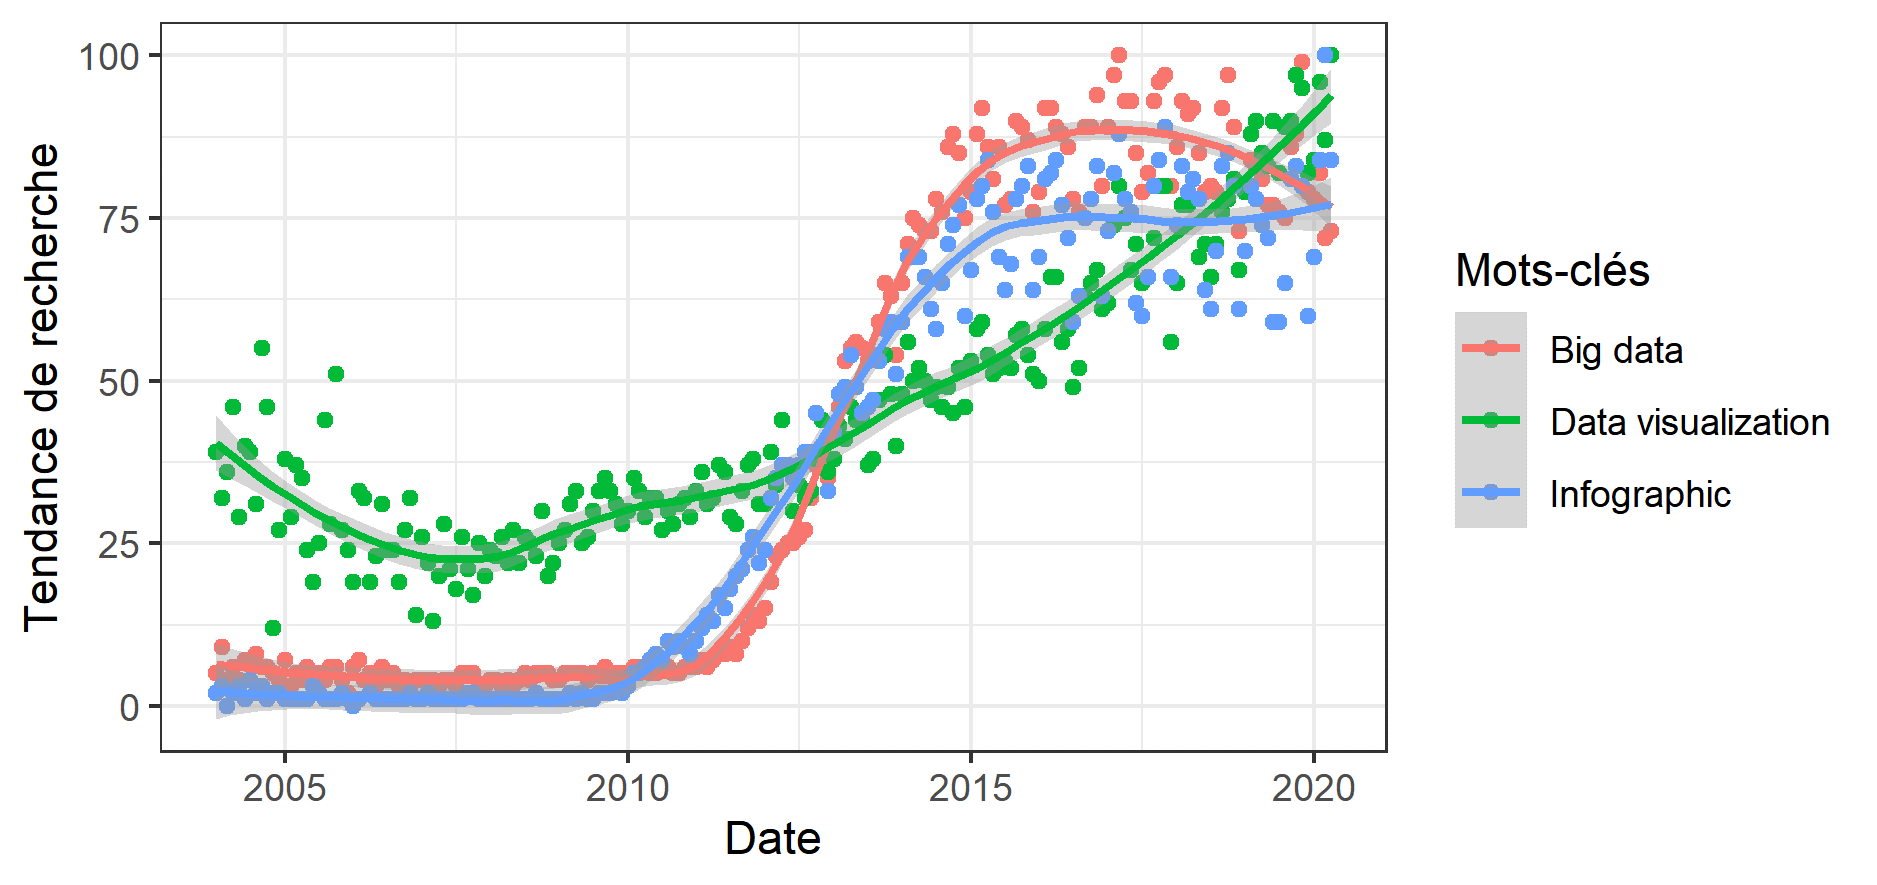
Google Trends est un outil de Google qui permet d’obtenir la fréquence à laquelle un mot a été recherché sur Google. Il est possible d’importer directement les résultats à l’aide de la library gtrendsR et visualiser les résultats avec ggplot. Les mots recherchés pour cette figure présente dans le manuscrit sont Big Data, data visualization, inforgraphic.
Le résultat
Comment faire ?
Langage : R
Information de la session
1
2
3
4
5
6
7
8
9
10
11
12
13
14
15
16
17
18
19
20
21
22
23
24
25
26
27
28
29
30
31
32
33
34
35
36
37
38
39
40
41
42
43
44
> sessionInfo()
R version 3.6.3 (2020-02-29)
Platform: x86_64-conda_cos6-linux-gnu (64-bit)
Running under: CentOS Linux 7 (Core)

Matrix products: default
BLAS/LAPACK: /shared/mfs/data/software/miniconda/envs/r-3.6.3/lib/libopenblasp-r0.3.9.so

Random number generation:
RNG: Mersenne-Twister
Normal: Inversion
Sample: Rounding

locale:
[1] LC_CTYPE=en_US.UTF-8 LC_NUMERIC=C LC_TIME=en_US.UTF-8 LC_COLLATE=en_US.UTF-8
[5] LC_MONETARY=en_US.UTF-8 LC_MESSAGES=en_US.UTF-8 LC_PAPER=en_US.UTF-8 LC_NAME=C
[9] LC_ADDRESS=C LC_TELEPHONE=C LC_MEASUREMENT=en_US.UTF-8 LC_IDENTIFICATION=C

attached base packages:
[1] grid stats graphics grDevices utils datasets methods base

other attached packages:
[1] rvest_0.3.5 scales_1.1.1 ggrepel_0.8.2 ggforce_0.3.1
[5] readxl_1.3.1 FactoMineR_2.3 factoextra_1.0.7 egg_0.4.5
[9] gridExtra_2.3 ontologyIndex_2.5 reshape2_1.4.4 dplyr_0.8.5
[13] plotly_4.9.2.1 ggplot2_3.3.1 igraph_1.2.5 visNetwork_2.0.9
[17] DT_0.13 seqinr_3.6-1 xml2_1.3.2 jsonlite_1.6.1
[21] httr_1.4.1 colourpicker_1.0 shinyhelper_0.3.2 shinycssloaders_0.3
[25] shinyWidgets_0.5.1 shinydashboardPlus_0.7.0 shinydashboard_0.7.1 shinyalert_1.0
[29] shinyjs_1.1 shiny_1.4.0.2

loaded via a namespace (and not attached):
[1] tidyr_1.1.0 viridisLite_0.3.0 assertthat_0.2.1 selectr_0.4-2 cellranger_1.1.0
[6] yaml_2.2.1 pillar_1.4.4 lattice_0.20-41 glue_1.4.1 digest_0.6.25
[11] promises_1.1.0 polyclip_1.10-0 colorspace_1.4-1 htmltools_0.4.0 httpuv_1.5.2
[16] plyr_1.8.6 pkgconfig_2.0.3 purrr_0.3.4 xtable_1.8-4 tweenr_1.0.1
[21] later_1.0.0 tibble_3.0.1 farver_2.0.3 ellipsis_0.3.1 withr_2.2.0
[26] lazyeval_0.2.2 cli_2.0.2 magrittr_1.5 crayon_1.3.4 mime_0.9
[31] fansi_0.4.1 MASS_7.3-51.6 tools_3.6.3 data.table_1.12.8 lifecycle_0.2.0
[36] stringr_1.4.0 munsell_0.5.0 cluster_2.1.0 ade4_1.7-15 flashClust_1.01-2
[41] compiler_3.6.3 rlang_0.4.6 rstudioapi_0.11 htmlwidgets_1.5.1 crosstalk_1.1.0.1
[46] leaps_3.1 miniUI_0.1.1.1 gtable_0.3.0 curl_4.3 R6_2.4.1
[51] fastmap_1.0.1 stringi_1.4.6 Rcpp_1.0.4.6 vctrs_0.3.0 scatterplot3d_0.3-41
[56] tidyselect_1.1.0